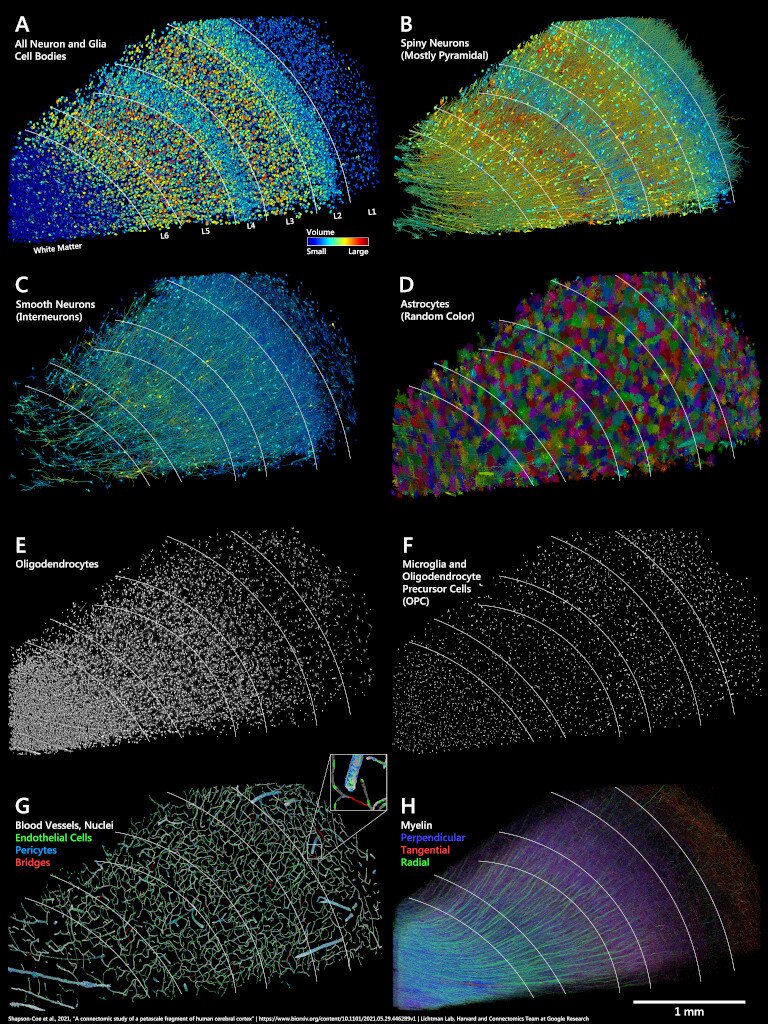
A visual demonstration of various distributions among the cortical layers found in the sample. Click for full resolution image (57.4 MB).
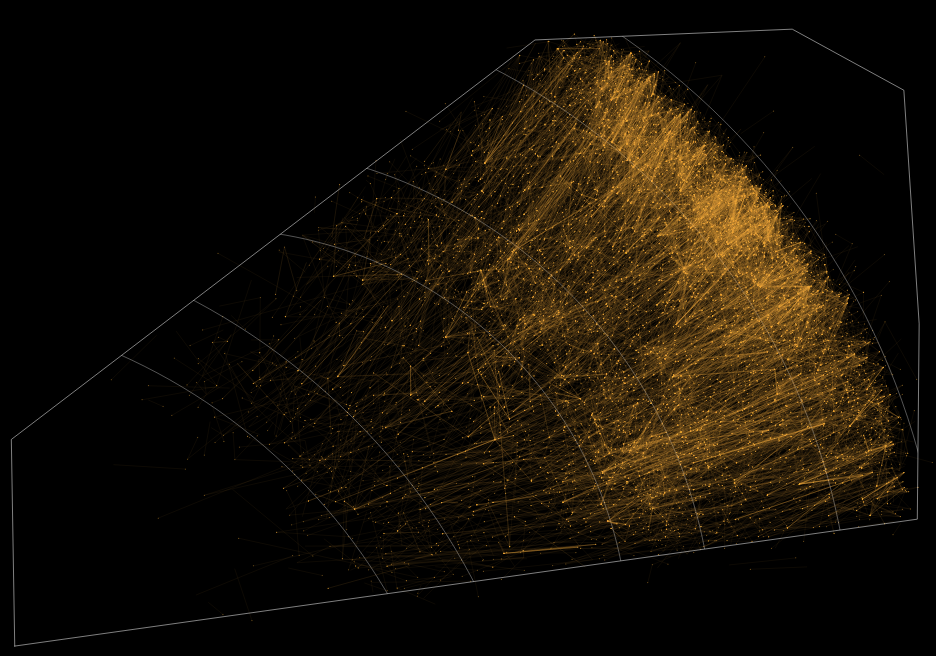
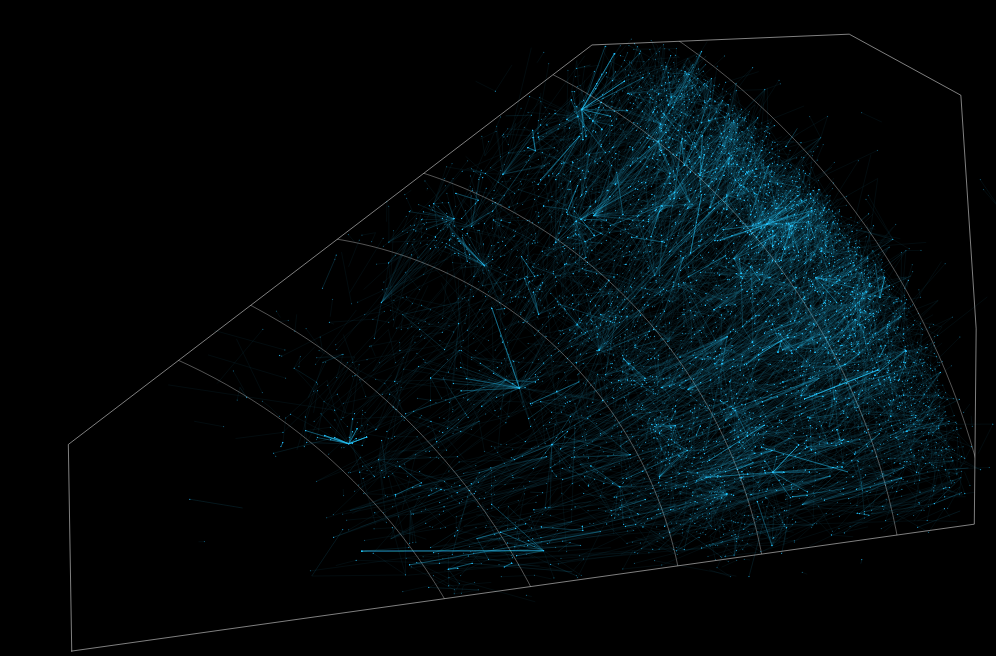
Directed graph of all outgoing excitatory (orange) and inhibitory (blue) synapses originating from one cell to another where both cells have a soma in the volume.


