Self-supervised Embeddings
Paper: Multi-Layered Maps of Neuropil with Segmentation-Guided Contrastive Learning
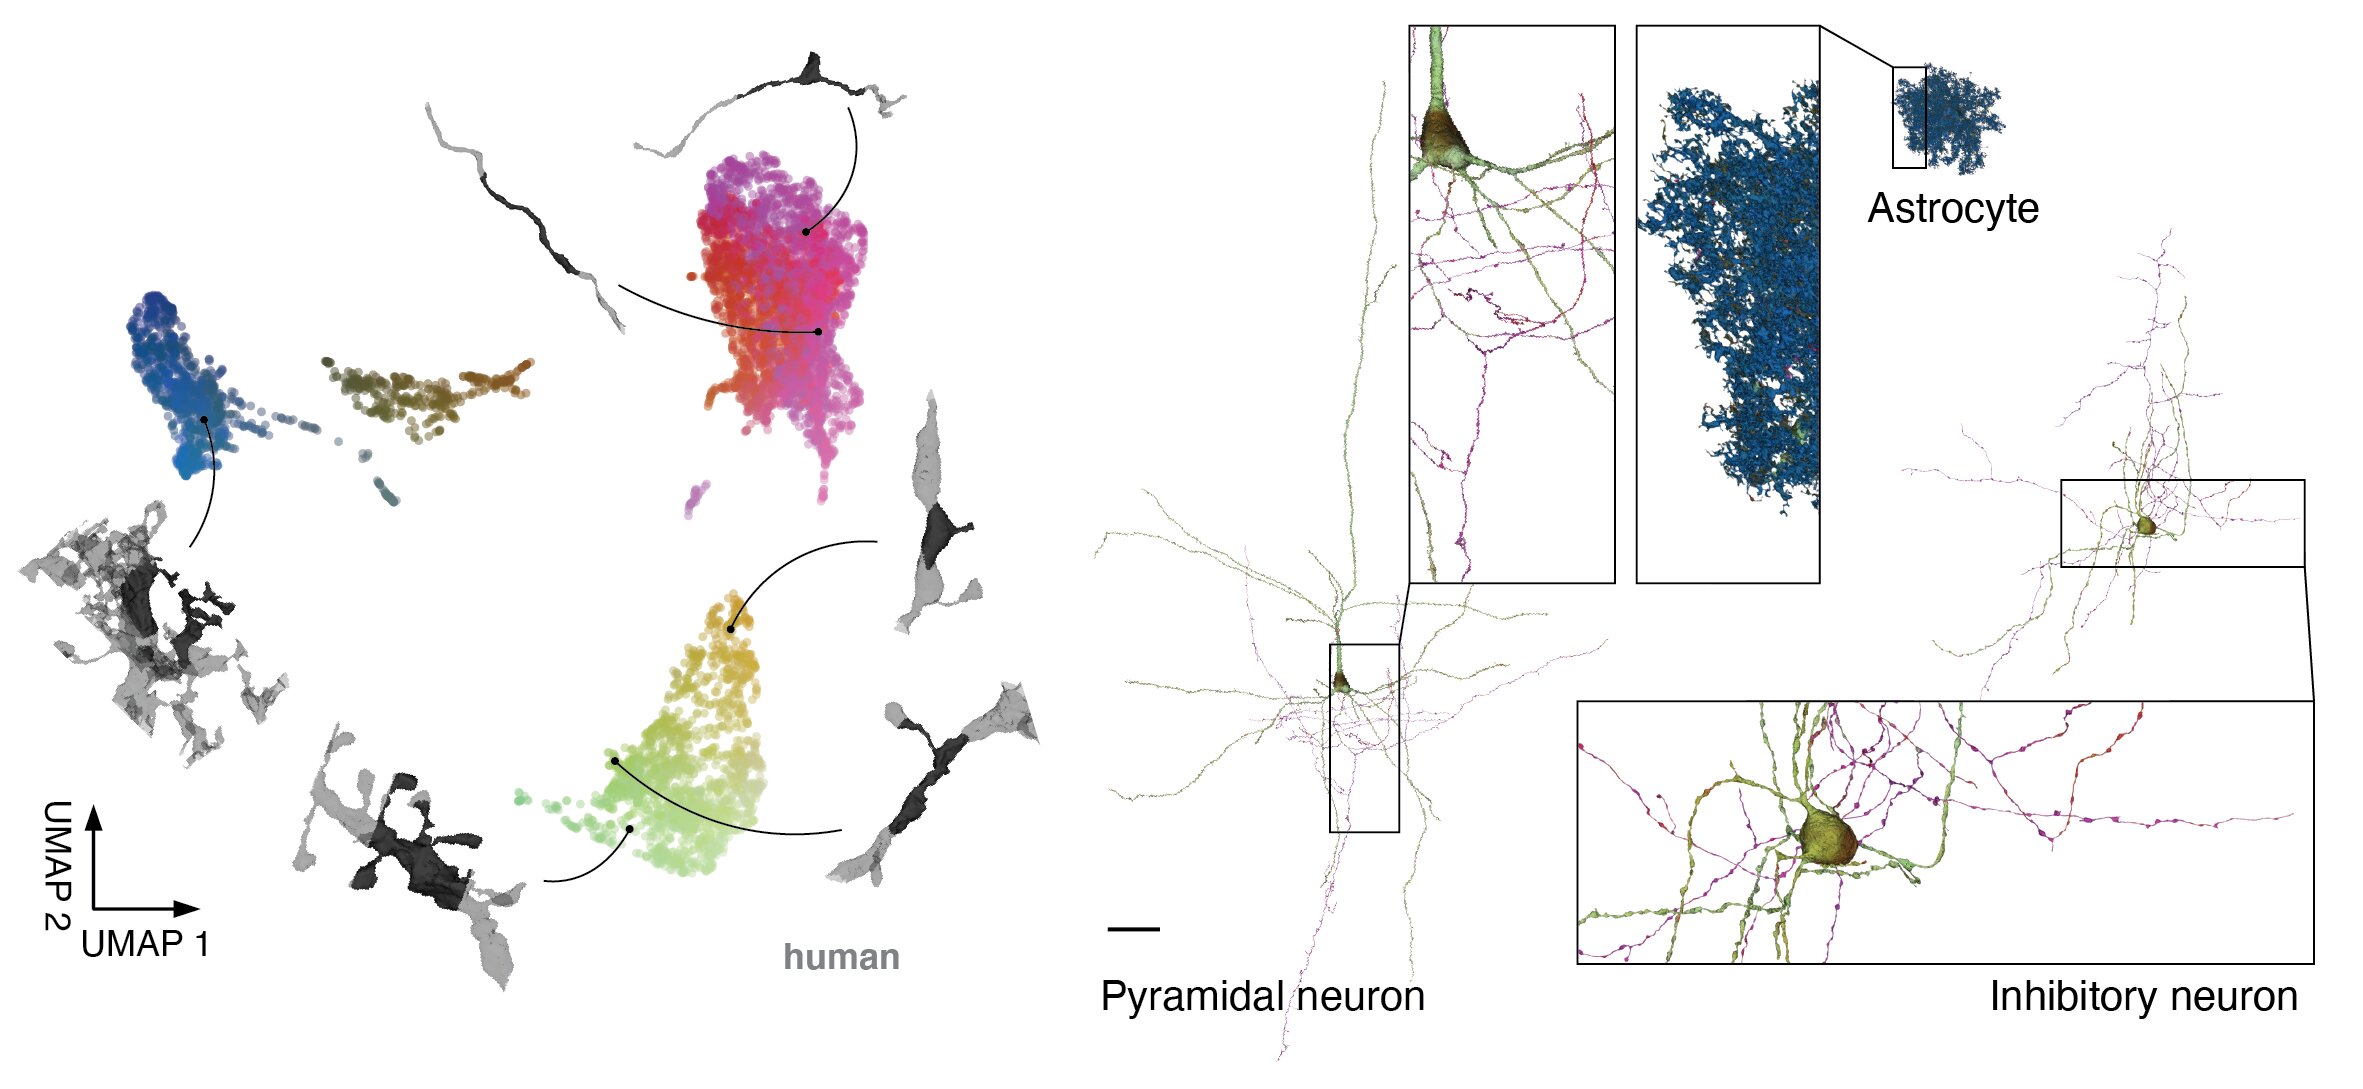
To accelerate analysis and exploration of H01, we produced embeddings for local cutouts with a neural network. This network was trained using a variant of the SimCLR self-supervised learning framework, meaning no labels were presented during training. We computed embeddings for 20% of all skeleton nodes (~4 billion in total) and reduced them to 3 dimensions using UMAP for visualization and color mapping. This scatter plot shows a sample of these embeddings with the corresponding 3d morphology illustrated for 6 locations. To display the embeddings across entire cells, we colored the cell meshes according to the 3d UMAP RGB of the nearest embedding for the surrounding local 3d view.
Interactive exploration
For interactive exploration, one can click on points in this scatter plot to bring up the corresponding image and segmentation data in neuroglancer.
Or open the full dataset in Neuroglancer to explore the complete released embeddings.
Data access
We make the embeddings for H01 available as sharded csv files under the path format:
gs://h01-release/data/20220326/c3/embeddings/segclr_csvzips/[1-10000].zip(total download size is ~1TB)
The readme describing the data format is available here:
gs://h01-release/data/20220326/c3/embeddings/segclr_csvzips/README(link)
An example Colabratory notebook is available to demonstrate how to read and download the sharded CSV format.
Note: More updates will be available soon.